🚀 Netifyd Dashboard pour OpenWrt
Dashboard de Network Intelligence avec Deep Packet Inspection pour visualiser applications, protocoles et appareils sur votre réseau OpenWrt.
Netifyd Dashboard
Network Intelligence pour OpenWrt
Visualisez en temps réel les applications, protocoles et appareils sur votre réseau grâce au Deep Packet Inspection. Identifiez Netflix, YouTube, Zoom et 1000+ applications au-delà des simples ports.
🎯 Pourquoi le Deep Packet Inspection ?
Sans DPI, tout le trafic HTTPS est indiscernable :
| Port 443 classique | Avec Netifyd DPI |
|---|---|
| HTTPS | 🎬 Netflix |
| HTTPS | 📺 YouTube |
| HTTPS | 📹 Zoom |
| HTTPS | 💬 Discord |
| HTTPS | 🎮 Steam |
Netifyd identifie 300+ protocoles et 1000+ applications en analysant le contenu des paquets, pas seulement les ports.
✨ Fonctionnalités
Flux réseau
Connexions actives en temps réel avec source, destination, application et catégorie.
Applications
Détection automatique : Netflix, YouTube, Zoom, Teams, Discord, Steam, Spotify...
Appareils
Découverte automatique avec identification du fabricant et hostname DHCP.
Protocoles
Distribution TCP/UDP/QUIC avec graphiques donut interactifs.
Catégories
Classification automatique : Streaming, VoIP, Social, Gaming, Network...
Bande passante
Trafic RX/TX par application avec pourcentages et barres de progression.
🎮 Démo interactive {#demo}
Explorez l'interface avec des données simulées. Flux réseau, applications détectées, appareils découverts — tout fonctionne comme sur un vrai routeur avec Netifyd.
🏗️ Architecture
1 | ┌─────────────────────────────────────────────────────────┐ |
Le dashboard ne fait aucune inspection — il visualise les données produites par le daemon Netifyd.
📦 Installation
Prérequis
- OpenWrt 21.02 ou supérieur
- Netifyd installé et actif
- LuCI (interface web OpenWrt)
1 | # Installer Netifyd |
Depuis les sources
1 | # Dans votre environnement de build OpenWrt |
Installation manuelle du .ipk
1 | # Transférer le package sur votre routeur |
Accès au dashboard
Après installation : Status → Netifyd Dashboard
🎨 Design
Thème Network Intelligence inspiré des outils de SOC :
| Élément | Valeur |
|---|---|
| Background | #0a0f1a (noir profond) |
| Cards | #111827 |
| Accent principal | #8b5cf6 (violet) |
| Accent secondaire | #3b82f6 (bleu) |
| Streaming | #ec4899 (rose) |
| VoIP | #10b981 (vert) |
| Network | #f59e0b (orange) |
| Typographie données | JetBrains Mono |
| Typographie UI | Inter |
Catégories colorées pour identifier rapidement le type de trafic.
📊 Vues disponibles
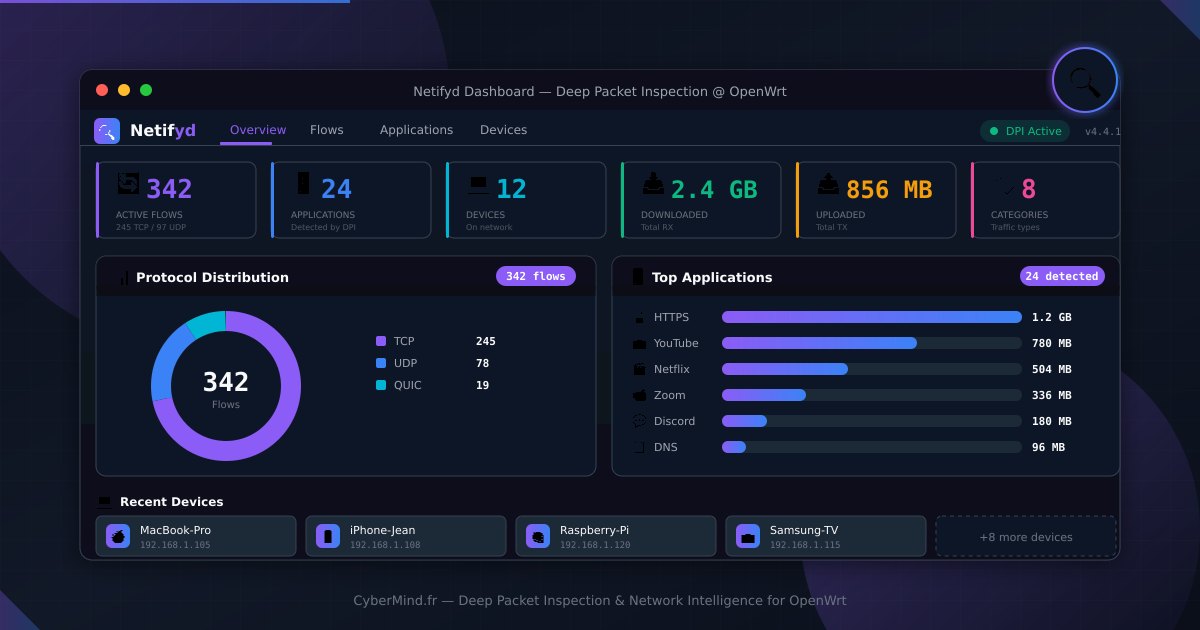
Overview
Vue principale avec quick stats, distribution des protocoles (donut), top applications par bande passante.
Flows
Table des connexions actives avec protocole, source/destination, application détectée, catégorie et trafic.
Applications
Liste des applications détectées avec nombre de flux, trafic total et pourcentage.
Devices
Grille des appareils découverts avec hostname, fabricant, IP, MAC et interface.
🔧 Configuration Netifyd
Fichier /etc/netifyd.conf :
1 | # Interfaces à surveiller |
📋 Roadmap
- Vue Overview avec stats et graphiques donut
- Vue Flows avec table temps réel
- Vue Applications avec tri par trafic
- Vue Devices avec découverte automatique
- Historique 24h/7j (stockage SQLite optionnel)
- Alertes sur applications spécifiques
- Intégration firewall (blocage d’applications)
- Export CSV/JSON des données
- Graphiques temporels
- Mode kiosk pour affichage dédié
🤝 Contribuer
Le projet est open-source sous licence Apache-2.0. Les contributions sont bienvenues !
📚 Ressources
- Documentation Netifyd
- OpenWrt Wiki - Netifyd
- Netify DPI Signatures
- Article de blog : Présentation du dashboard